Row x Column x Detail
Rows are ticker symbols: ETFs (Exchanged Traded Funds), then stocks, then leveraged ETFs, sorted by asset or market capitalization, so you see where the market invests in the most.
The 3 groups: ETFs, stocks, leveraged ETFs, are ordered more predictable first. Unexpected drops are generally smaller for ETFs, because they average drops with jumps from many stocks, most of the times. However, the best ETFs can drop more than the best stocks when the market dives, or jump less than the best stocks when the market bounces back, shown by very different beta coefficients for the dive and bounce segments.
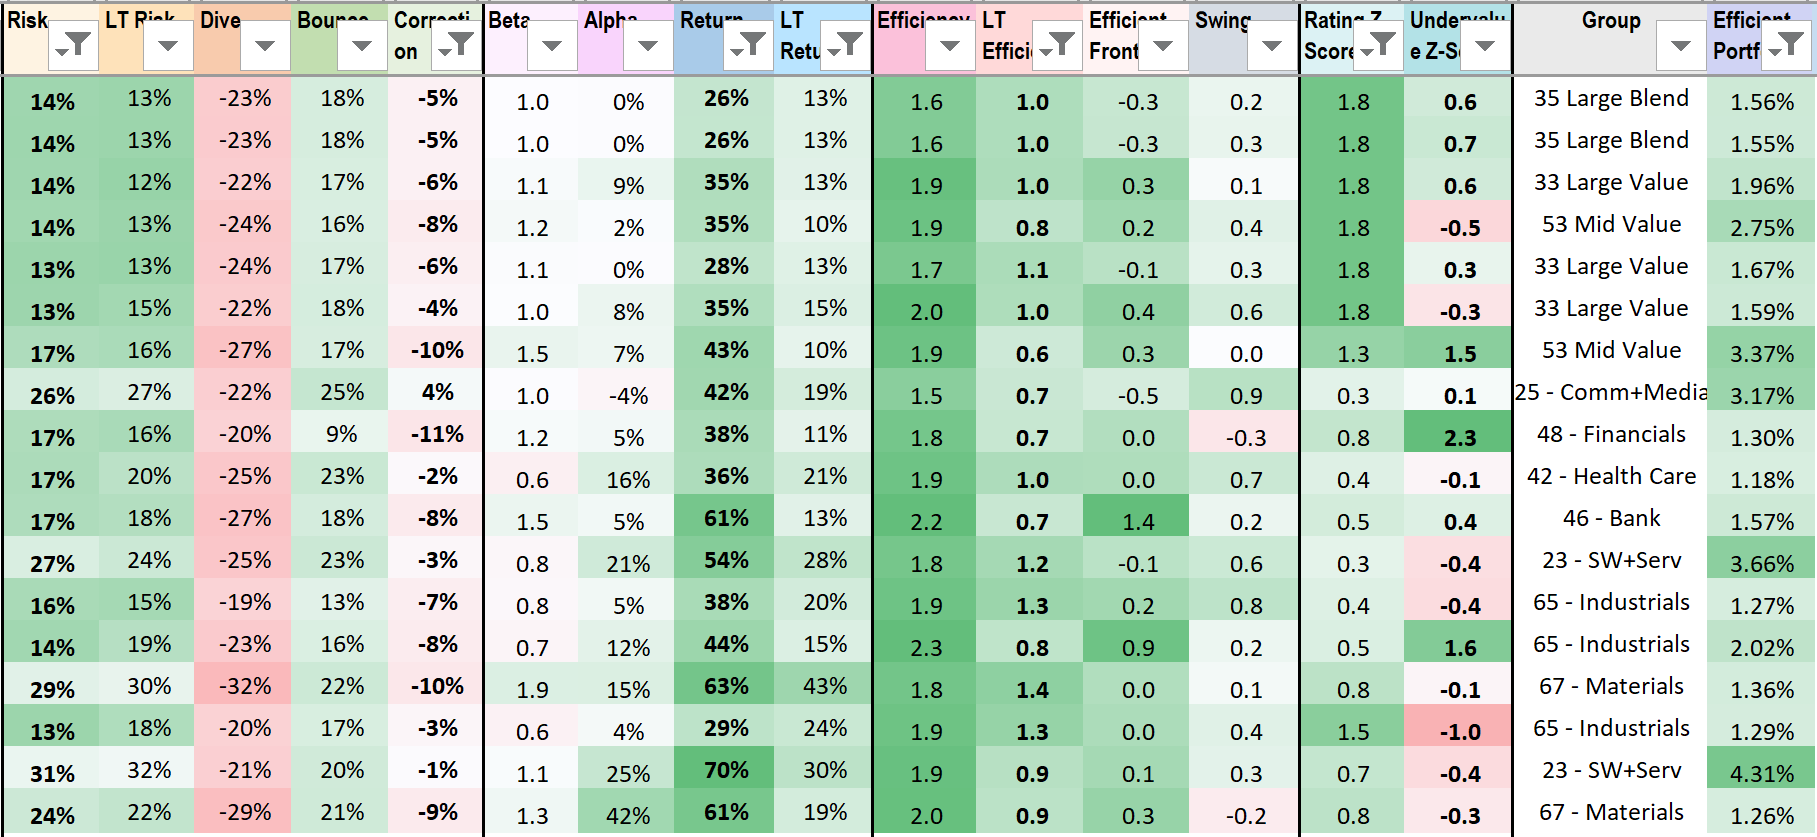
Columns are measurements or predictions organized from left to right into 5 groups:
Risk, as standard deviation of drops in normal market, height in abnormal markets.
Return, as growth rate from price gain, yield from fixed income, in both good and bad times.
Efficiency, as return/risk ratio or a z-score, to maximize return and minimize risk.
Swing if risk decreases and return increases more than most tickers in the market.
Fundamentals, yields from quarterly reports, ratings and growth estimates from analysts.
Allocation, to get optimum portfolio on efficient or swing frontier.
The 5 groups: Risk, Return, Efficiency, Fundamentals, Allocation, are ordered most important first to long-term investors, who want to buy and hold, not to trade the swing in weeks, days, or hours. Risk is very repeatable, slowly changing over years, so you can plan ahead by investing in lower risk tickers.
You can view risk, return, efficiency, swing as technicals, derived from price and volume data in the open market. Yields, analyst ratings, growth estimates, undervalue z-scores are fundamentals, based on financials in quarterly reports. Your selection and allocation must be based on both technicals and fundamentals.
Details are past history or components, so you can explore further. Past measurements of risk, return, efficiency are highlighted with -nY, to show the past dates in years.
If you open Rating Z-Score, you see the components: yield in earnings, sales, … especially debt and cash flow, which are pulled from the most recent quarterly reports by analysts, then downloaded through our brokerage.