Get Spreadsheets to Invest on
the Efficient Frontier
Current year-month, to invest on the future and long-term efficient frontier now. Start with 50-best tickers on either, or both, efficient and swing frontiers.
Past year-month, to compare today’s market with market at the top, bottom of last market crash: 2020-03-23.
Insert your tickers in the spreadsheet to compare them against the 50-best on the efficient or swing frontier. You can compare at 3 scales:
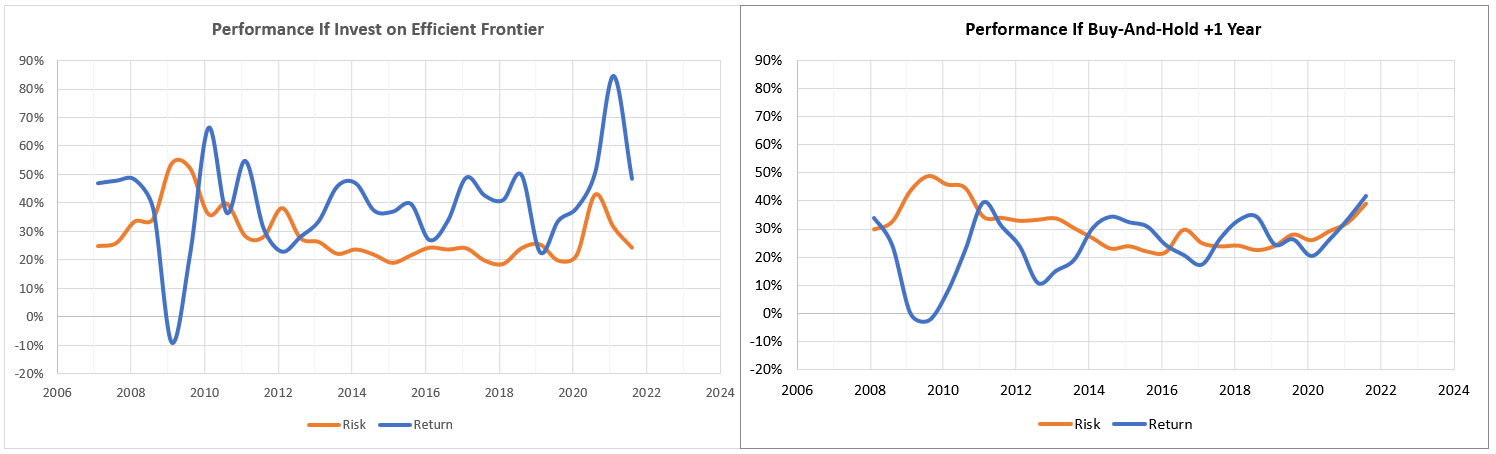
Long-term over 6-12 months, with long-term risk, return, and efficiency from -6 years, to pick tickers to buy and hold +12 months.
Medium-term over 2-4 months, with predicted future return to see future efficient frontier, then sine wave to get in/out in next +3 months.
Short-term over 1-2 months, to see fast changing swings in return, risk, efficiency, and sync your drop tolerance per day to our risk measurement.
Check the dive and bounce heights at past market corrections, then compare them to market (SPY) by using beta correlation coefficient. To hedge against future market crash of -15% to -50%, you need a large Crash Resistance factor = 0.75 * Bounce Beta - Dive Beta, i.e. dive less than market on the way down, and bounce more than market on the way up, like high tech that are in high demand even in tougher times.
Want to use our spreadsheets without Microsoft Excel?
Google Sheets
Apache OpenOffice Calc
Libre Office Calc
WPS Office Spreadsheets
Sign up to follow our updates delivered to your email every month. Unsubcribe here if not interested. Or come back here every 2-4 weeks to download new spreadsheets. Be mindful that our code & formulas are not widely tested yet. So always use a second source to do your research, before investing.
See something strange: risk, return, efficiency, allocation are not ordered quite right?
Send us an email, or discuss at our forum, so we can investigate your findings, improve our formulas and algorithms.