We Improve Until All Work
Measure risk as standard deviation of drops, at scales of day and week, over short-term of 6 months, medium-term of 2 years, and long-term of 6 years. Predicting the future risk is hard, but measuring the long-term risk over a very long history in the past is easy. Risk is measured with high-order moment, to be more sensitive to the few extreme drops that make you scared and sell to get out to cash.
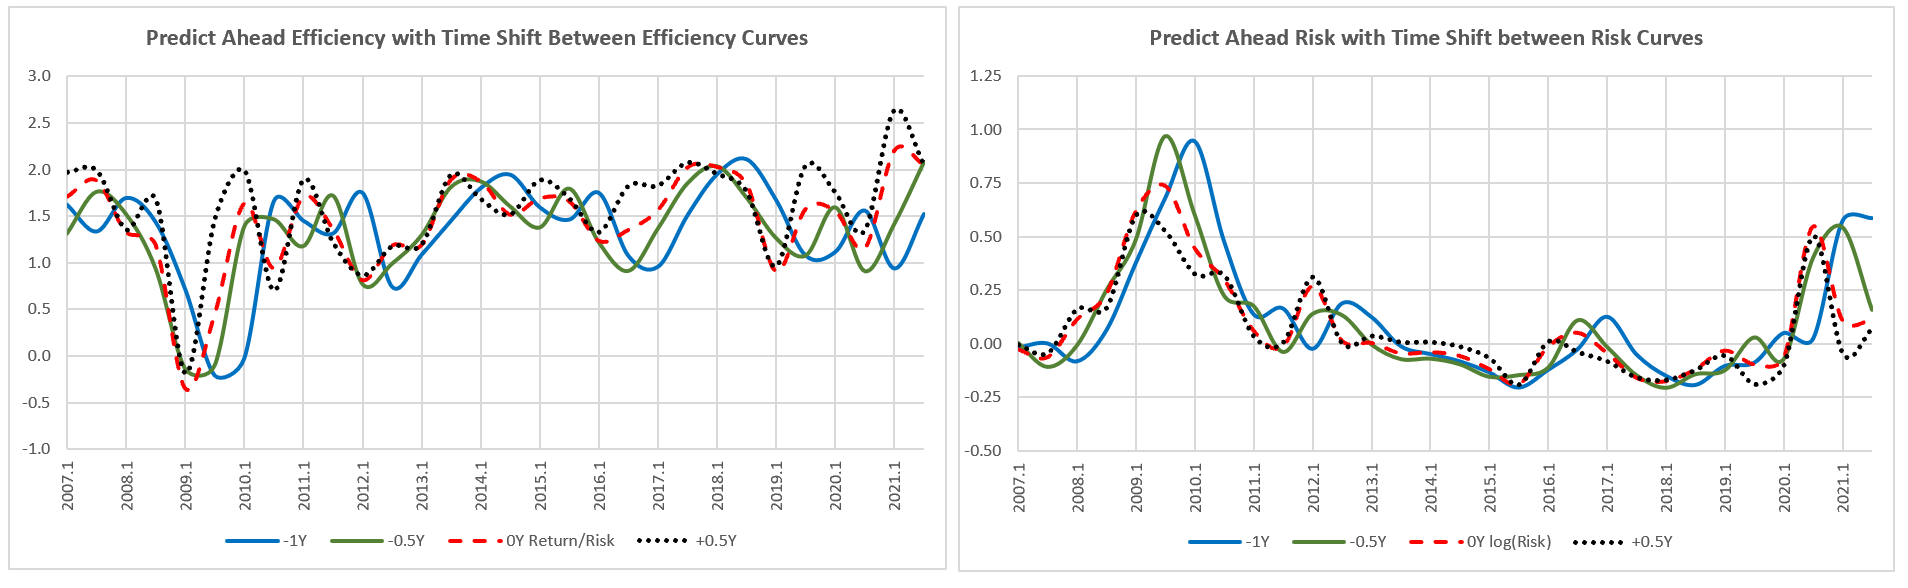
Measure return as most-likely average gain, robust to sharp jumps and drops, so user can see efficiency = return/risk, then see sine wave for periodic bull/bear phases and mean reversions.
Return is sum of predicted price gain, anticipated market correction, and fixed income yield. Efficiency is the ratio of all returns over all risks.
Invest on the future Efficient Frontier, to maximize efficiency measured over the long-term for buy-and-hold investors. Max return/risk is not measured in the past, but estimated in the future by extrapolation from the return(time) series. Machine learning with price & volume series will predict future return more accurately, not to day-week but to month-quarter scale.
Invest on the current Swing Frontier, to capture efficient tickers that have both decreasing risk and increasing return. You must research their fundamentals to see whether they are deep values on the way back, or dead beats going to bankruptcy. Bio-tech stocks tend to jump big after successfully passing a phase of clinical trials, or slide further down if failing. These big and sharp jumps and drops are impossible to predict from historical data.
Pull in fundamentals: yields, growth estimates, to get Undervalue Z-score. Combine analyst ratings, which are forward looking and possibly contradictory, but we need a weighted average for consensus rating.
The goal is to select 10-20 predictable, efficient or swing tickers, then search for optimum allocation, so your portfolio will always have maximum efficiency, best return/risk trade off, most efficient in up and down markets.
User will do final selection & allocation, so we display everything out in colors inside 1 spreadsheet, with graphs in risk x return space, or with slide shows in risk x return x time space.