How To Improve Your Portfolio
Download your portfolio and open the spreadsheet to copy column of tickers you invest in. Paste into My List column in Focus page. Toggle My List in Compare page to see up-to-date return/risk, then view their points in the graphs.
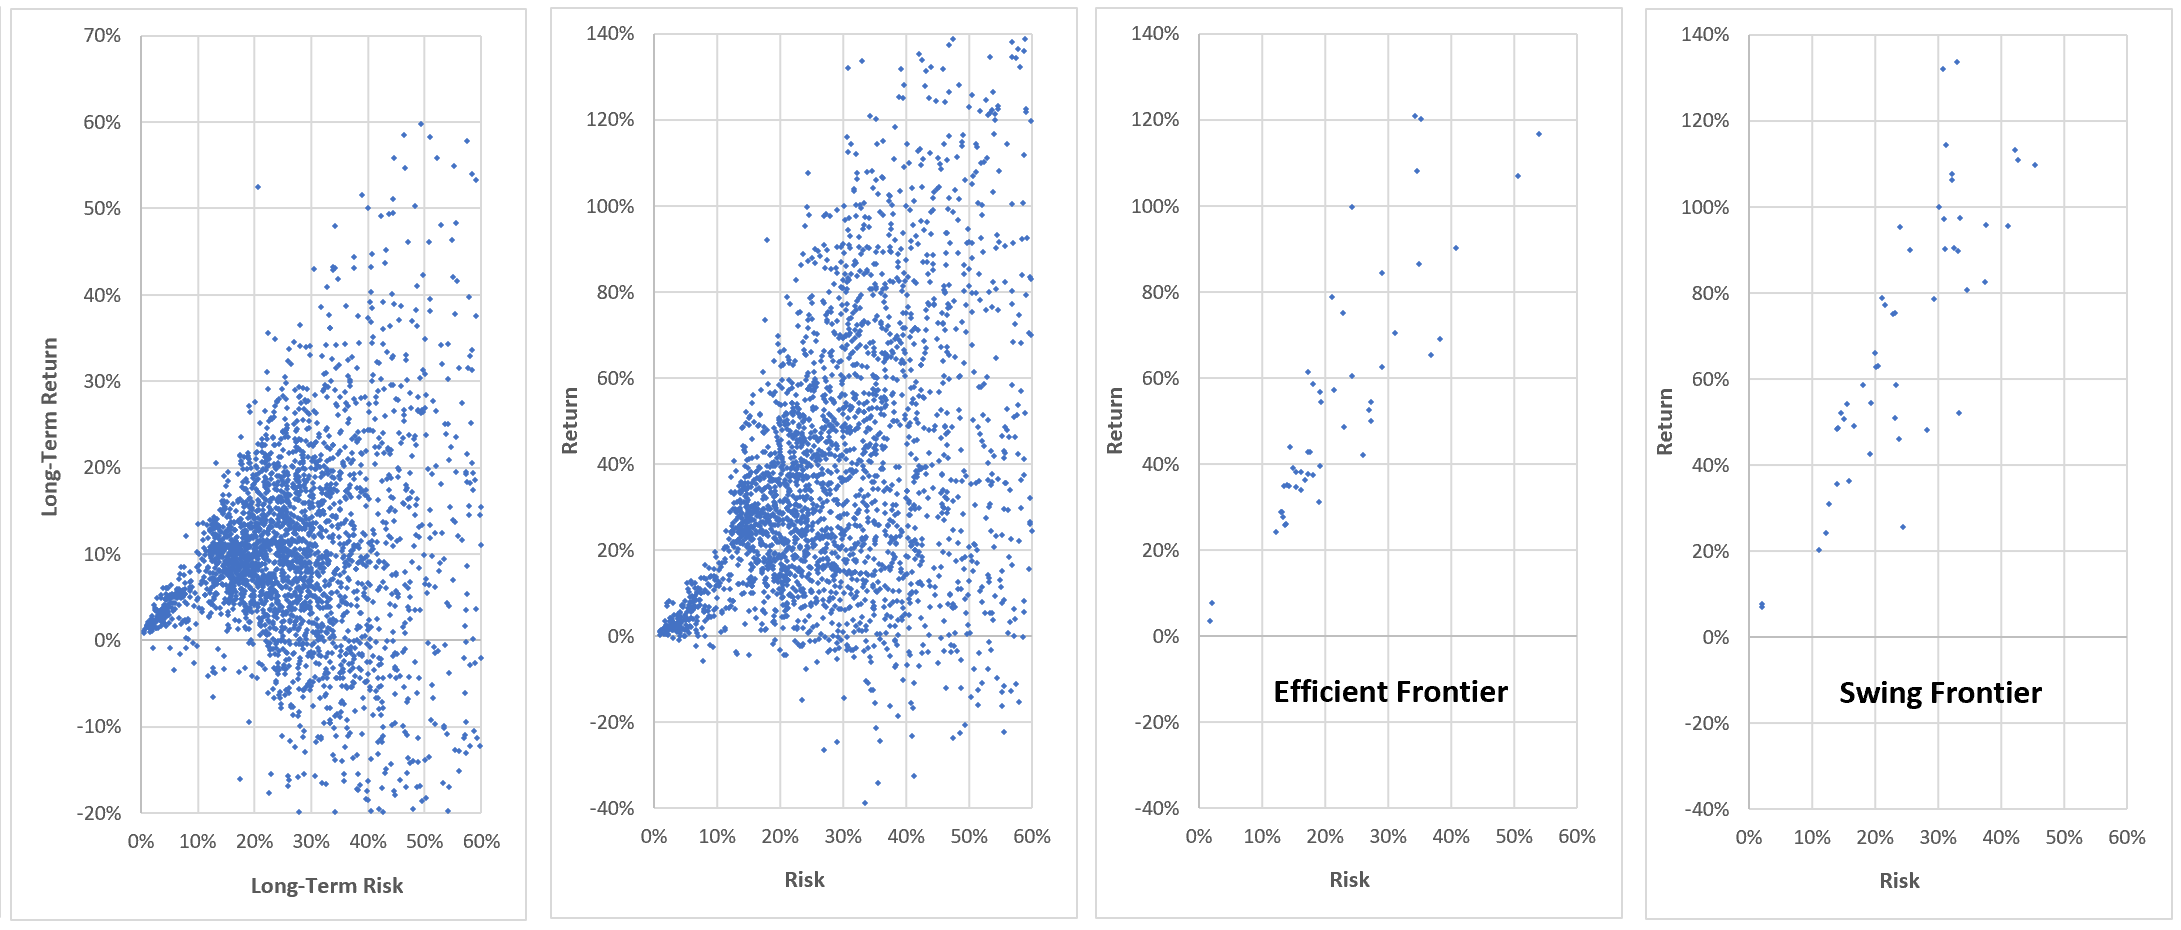
Toggle Best on EF or SF, to compare them to your tickers, so you can buy/sell more the most/least efficient tickers, swinging towards/away next efficient frontier.
Remove tickers by tagging their names with '-' in the Focus page, so VLOOKUP will skip them. Focus on max future efficiency, supported by fundamentals, future growth, voted by analysts, not by past or current return.
To compare tickers against their peers, sort by Efficient Frontier or Efficiency, then sort by Group = type.sector.industry.
First, remove most risky tickers using: Risk, LT Risk, Correction, because risk is very repeatable. Next, remove tickers with worst: LT Return, Rating Z, Undervalue Z, which repeat better than Return in the future. View their locations relative to EF and their peers in the graphs. Open LT Return to see Phase, Period, Mean Reversion.
Buy more tickers that are efficient compared to peers on EF, will swing up, Phase = [Slow-Lo, Fast-Up], near or beyond bottom price. Sell more tickers that are inefficient compared to peers on EF, will swing down, Phase = [Slow-Hi, Fast-Dn], near or beyond top price.
Over months, your portfolio will converge to the optimum, all tickers are near EF, and you can hold 1+ year out of a period ~= 2 years.