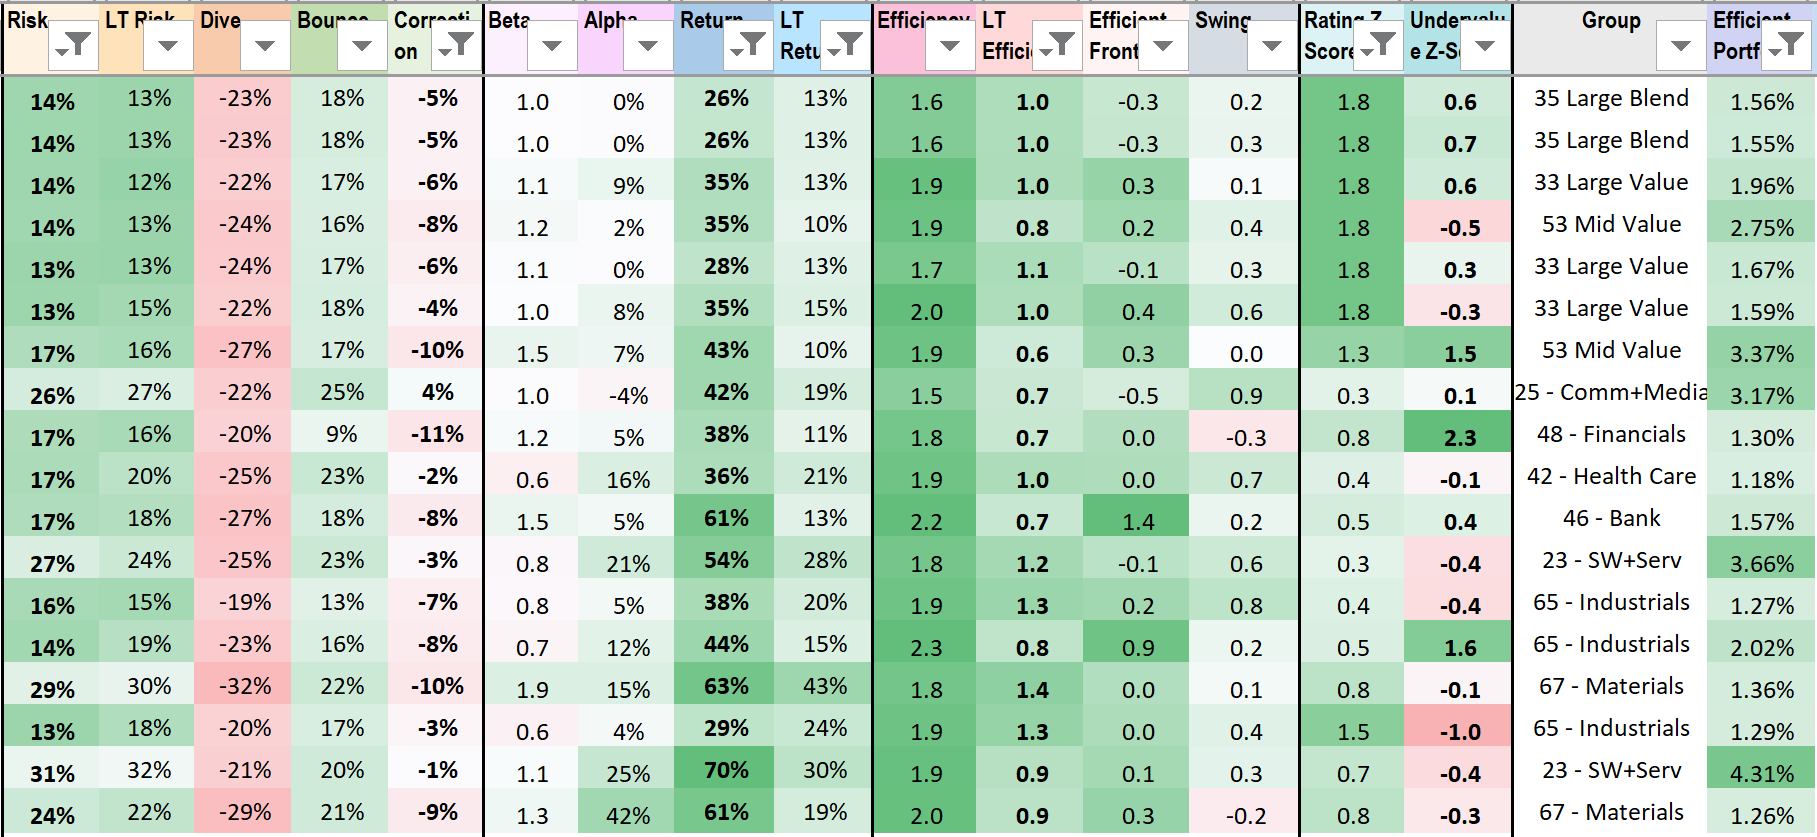
Compare to Previous Work
Efficiency is more than Sortino ratio, which is more than Sharpe ratio.
We keep on improving formulas & code to measure risk, return, and efficiency until all tickers have correct sorting order for common long-term investors, until ETFs and stocks, large and small caps, mature and young companies, all have correct locations relative to the efficient frontier, so they can be compared.
Return is natural log displayed in %, not return rate r = P2/P1 - 1.
Return = log(P2/P1) = log(P2) - log(P1), a difference of 2 log prices distant by 1 year.
Please memorize the successive square roots of 2, and their natural logs displayed here in %. log(P2/P1) ~= +70%, +35%, +17%, +9%, +4%, means doubling your investment after 1, 2, 4, 8, 16 years. Negative means halving your investment. Zero means constant price.
You must predict the future, to invest now and hope to gain later.
Extrapolation based on a sine wave model for return(time) curve is just an approximation, a baseline to compare machine learning accuracy. We will use machine learning to predict future price at +3, +6, +9, +12 months. Not easy when you only have 2-20 years of data.
You must select, allocate, for next year's efficiency, based on your risk tolerance and rotation frequency.
We show you how the efficient frontier has been rotating about (0,0) over -15 years, what happened in 2008, and how by investing on this EF, your portfolio had good return, but also 2x larger drop in 2008.
Investing with many tickers on the future EF is all you need. Let the market data guide you, because millions of investors already predicted ahead. Watch out for fast swings in the market, and keep your focus on the long term, which requires research on the fundamentals, so you believe in the tickers you invest your savings in.
Or better yet, invest with tickers that are both on the efficient and swing frontiers. These turn-arounds have efficiency that increases much sharper than others, because both return increases and risk decreases more than market.