
Invest with Data
On The Efficient Frontier
Do you want to compare risk & return for all investments, then check fundamentals, to select the most efficient?
We measure risk as standard deviation from extreme drops, sensitive to the few that scare you the most.
We predict return for normal markets, measure dive and bounce heights from recent market corrections.
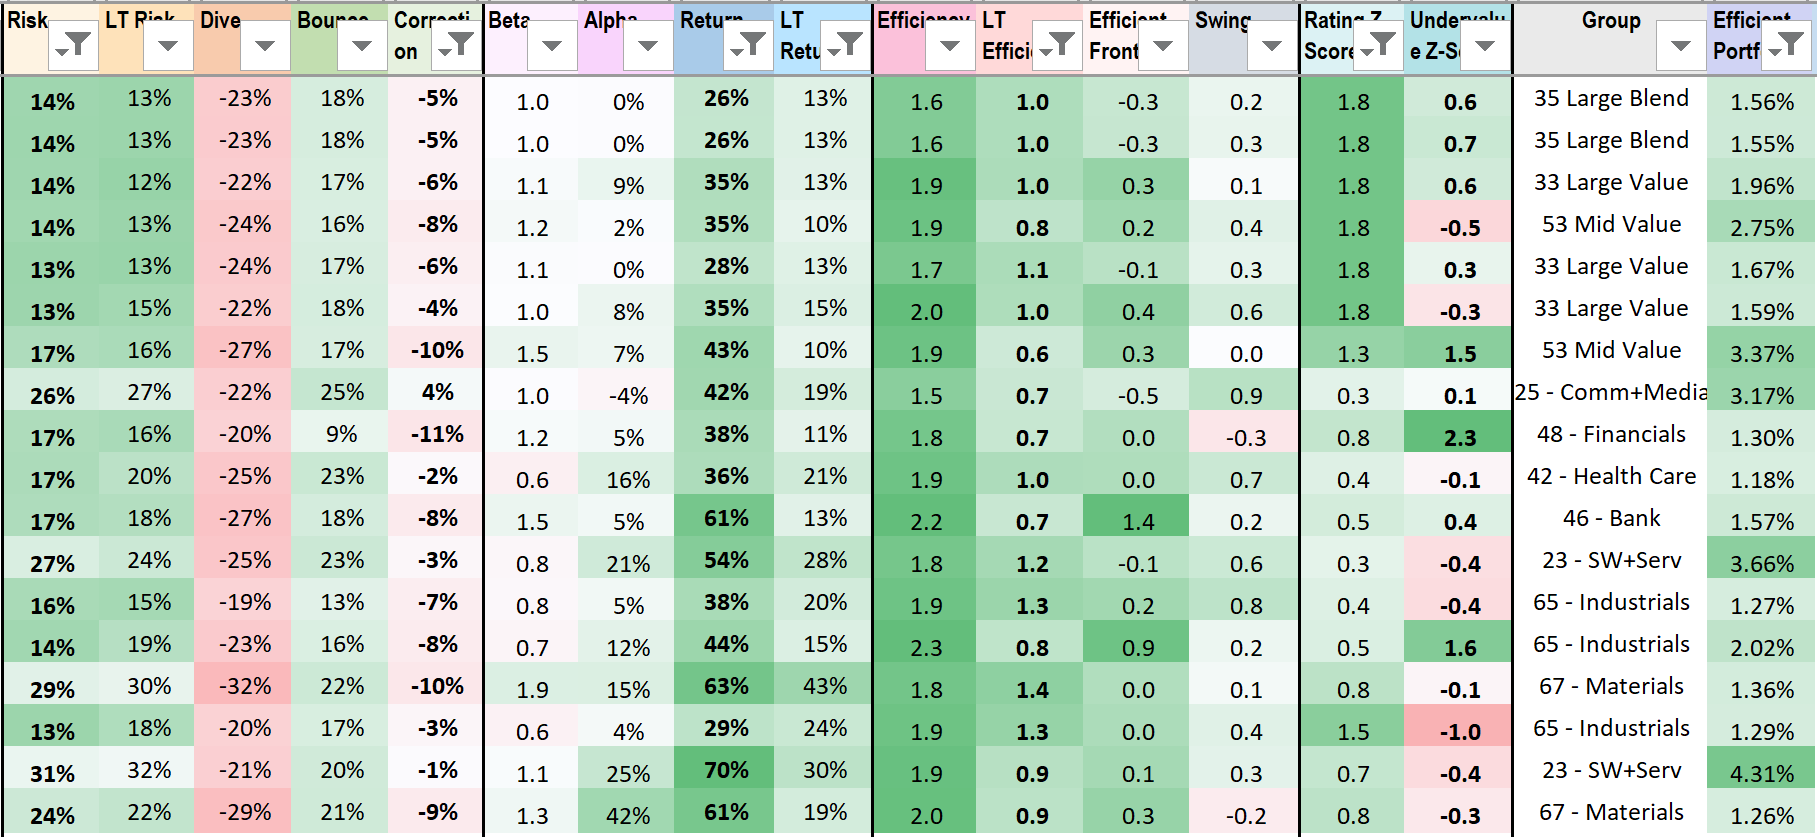
Download spreadsheet to check out where your favorite investments are, relative to others in the market.

We show you the Efficient Frontier: tickers with min risk and max return, in both good times and bad.
You should invest on the Efficient Frontier, after you check all the fundamentals, technicals, and past performances.
Or invest on the Swing Frontier, efficient tickers with decreasing risk and increasing return, swinging fast towards the Efficient Frontier.
No stock tip, just trend computed from data, so you can compound your savings with the best in the market.
You must do your homework. Compare, research, then invest in many tickers, to diversify and get expected efficiency. Adjust every week, so your portfolio moves to the future efficient frontier, in both good times and bad.
We collect all relevant technical, fundamental, historical data into a spreadsheet, then send it to you every month, to help you invest on the efficient frontier. Or you can email your portfolio to our server and get back suggestions on the smallest changes that will improve your portfolio’s efficiency the most.

Your portfolio return will be impressive, compared to your exposed risk, even in 2008.
Buy and hold for 1+ year will result in a smaller return, because some of the best investments swing away from the efficient frontier, as others move towards the future efficient frontier. Notice how risk and return are much higher now compared to a few years ago.
Can we apply formulas to market data to reveal past trends to help us predict and invest? Yes, we can. With past data, we measure past risk, return, efficiency so you compare and select the ETFs and stocks that performed best in both good times and bad.
We find that return, log(risk), and log(volume*price) can be approximated well with sine wave about a straight axis, so knowing the period ~= 2Y and the amplitude in % will allow us to extrapolate this periodic trend to months into the future.

Can we predict ahead the most efficient tickers using the same data? Yes, we can predict risk, return, efficiency at 0Y, then at +0.5Y, instead of measuring at past -1Y or -0.5Y.
You can inspect the 4 efficient frontier curves at right, for a time shift of 0.5Y between the 4 curves. Smaller time shift means less accurate, little to no prediction.
Larger oscillation amplitude means a scaling bias from curve extrapolation with derivatives when future data is missing.
You clearly see the limit of predicting farther into the future. Between 0Y and +0.5Y, there is less time shift or less prediction power, especially at 2008-2009. The larger slope of the efficient frontier means we are predicting return that is larger, or risk that is smaller, or both, so the efficiency is too good to be true, a very dangerous systematic error.
We expect Machine Learning to predict more accurately the future return and risk from price and volume series, better than simple sine wave extrapolation.